| The GPI | Research | Media Gallery | About Us | Youth | Members | Resources |
|
Media Clipping — Spring 1999, Between The Issues
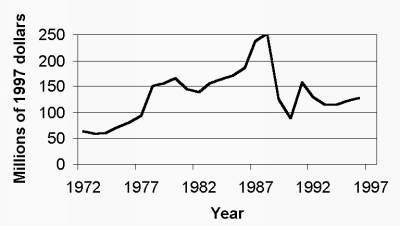
Nova Scotia's Fisheries and the Genuine Progress Indexby Tony Charles and Amanda LaversMedia reports on Nova Scotia's fishery usually focus on how much fish is caught, fisher incomes, fish exports, and total revenue. All of these factors contribute to the Gross Domestic Product, the conventional measuring stick of the economy. These measures, however, do not capture all that we value in a fishery. To produce a more comprehensive assessment of the fishery, and to measure its progress towards sustainability, a Fisheries Account is being developed within the framework of the Genuine Progress Index, as introduced in the previous BTI. The discussion here highlights some major themes of the GPI Fisheries Account. (This article is based on preliminary analysis; results are subject to change.) Natural Capital and DepreciationTraditionally, we have assessed the economic performance of Nova Scotia's fishery by adding up all the revenue obtained from catching and selling fish. This practice misses a critical point: it does not account for the value of fish remaining in the ocean after the fishery has taken place, or any damage to the natural system which maintains the fishery. The fish in the sea, the quality of the water, the ocean bottom habitat, and all the other elements of the marine environment constitute natural capital - this is what keeps the fishery functioning and needs to be recognized as having real value, value that can be measured partly in monetary terms. Consider a particular fish species such as haddock. Every year, government scientists try to estimate the total amount (weight or 'biomass') of haddock in the oceans around Nova Scotia. If we multiply such an estimate of biomass by the price of haddock, this produces a monetary value for all the haddock in Nova Scotia's waters. In 1997, for example, this amounted to $128 million. This figure is merely an illustration of the value of the fish in the sea, a value that could theoretically be obtained if every haddock were caught and sold. Of course, in reality, this would be impractical and undesirable, because in a sustainable fishery, the fish stock is maintained at a healthy level and we live off the annual growth. A sensible manager considers fish in the sea to be like the assets of an investment that provides profit if properly maintained, or like funds in a savings account that earn interest which can sustain people's livelihoods. Nevertheless, this approach to measuring fish stock values can be used to reconstruct the past values of our fish stocks, by adjusting for fluctuating prices and for inflation. If we compare our current stocks to previous ones we can better understand what 'progress' we have made toward a sustainable and healthy fishery. See Figure 1 for an example of the haddock resource.
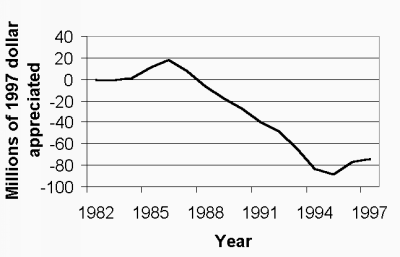
From 1980 to 1990, Nova Scotia's fisheries Gross Domestic Product (GDP) nearly doubled, suggesting great progress. While we were catching, selling, and exporting more and more fish, however, we were simultaneously depleting our natural capital. This is called resource depreciation and is analogous to what happens if the capital stock of a business (factories, equipment, etc.) wears out over time and is not replaced. In contrast to a piece of machinery, however, fish stocks can be self-sustaining and can naturally appreciate (grow) in economic value over time. If fish stocks are subjected to over-exploitation or other pressures, however, they will lose economic value. A clear example of resource depreciation is provided by Nova Scotia's cod stocks. Figure 2 shows the increasing gap between the potential value of cod stocks and the value they actually have. This gap represents the depreciation of our natural assets. This was determined relative to biomass levels in 1982; had it been relative to the biomass of cod 25, 50, or 100 years ago, the resulting depreciation would be even more dramatic.
If a private company allowed this level of depreciation in its produced capital, its factories would soon be falling apart. Yet in the fishery, this depreciation occurred behind the scenes while annual reports of progress told of high profits and a strong industry. The GPI fisheries account begins to remedy this flaw by measuring harvests in relation to stock values over time. Safe Catches and Corresponding Employment LevelsHistorical catch levels in Nova Scotia's fishery can help us to roughly estimate a 'safe' catch of fish that the ocean has consistently provided to fishers. The Nova Scotian lobster fishery, for example, consistently landed about 10,000 metric tonnes per year for the 50 years between 1920 and 1970. That level may not compare well with recent much higher landings, but its long duration suggests that historically it is indeed a safe level. The GPI fisheries account reviews such historical catches, to find not a maximum catch that could be taken from the resource, but rather a level of fishing that has been safe in the past.
These estimates of safe catch levels lead to a key question: How many jobs could there be in a sustainable fishery? This can be estimated by determining the 'gross revenue' (landed value) for each species, based on the safe catch level and appropriate prices, deducting the costs of harvesting, summing across species to get a total net revenue, and finally dividing this by an appropriate average annual fishing income to obtain the resulting employment level.
After adjusting for inflation and changes to the market price of fish products, the above method leads to an estimate of a livelihood carrying capacity for Nova Scotia's fishery. (In fact, an under-estimate is produced, because only lobster, scallops, herring and groundfish stocks are included here.) The calculations indicate that from the mid-1980s to the mid-1990s, the number of fishers that could be employed fishing full time, without over-exploiting the fish stocks, was in the range 9,000 - 13,000 (using the average Nova Scotian wage). Interestingly, Statistics Canada reported that during the same time period, between 6,000 - 12,000 Nova Scotians were actually occupied in the fishing industry. These numerical ranges are remarkably close. This does not imply that exploitation was sustainable over that time (which clearly was not the case) but rather that employment in a sustainable fishery need not be much lower than it has been in recent years. 'Genuine Progress' Sustainability Indicators
The above measurements are key ingredients to a more comprehensive assessment of 'genuine progress' in Nova Scotia's fishery. A full analysis must also include a range of ecological, economic, social and institutional factors. Such factors are called indicators because they provide indications of how well the fishery is faring from a sustainability perspective.
Socioeconomic Indicators:
Institutional Indicators:
These indicators are calculated, or assessed qualitatively, using a variety of data and information sources; details are provided in the GPI report. What are the implications of the GPI Fishery Account?What we measure is a sign of what we value. Traditional measures, such as fishery revenues, exports and employment, are relevant, but a preoccupation with these has misled us in the past. By failing to include such important factors as ecosystem health, fishery resilience, and resource depreciation in past calculations, strict economic accounting has given these vital factors an implicit value of zero. A full GPI analysis can help decision-makers distinguish between the real costs and benefits of different management options. This could help avoid what we saw in the fishery collapse - the devastation associated with a system of valuation that failed to account for its own future well-being. As Nova Scotia moves into the future, a key goal will be to ensure that its natural resources are used in a sustainable manner that benefits the people of the province, their communities, and the natural environment both now and in the future. Maintaining a system of GPI fisheries indicators may help guide us in this direction. Copyright © 1999, Tony Charles and Amanda Lavers
|
| ||||||||||||||||||||||||||
| The GPI | Research | Media Gallery | About Us | Youth | Members | Resources |
| Updated: 14-sep-07 webmaster@gpiatlantic.org | ||||||
|---|---|---|---|---|---|---|


